

Executive Summary
The evidence assembled in this report — the uploaded twelve-month rolling (year-on-year) asset-class return history in USDZAR, current US Federal Reserve and South African Reserve Bank (SARB) policy communications, the July 2026 International Monetary Fund (IMF) World Economic Outlook Update, the World Bank’s April 2026 Commodity Markets Outlook, and recent Bloomberg-, Reuters- and bank-sourced consensus surveys on currencies, gold and global equities — together favour a continued overweight to South African domestic real and fixed-income assets (inflation-linked bonds, nominal bonds, listed property and equities) over unhedged offshore, US-Dollar-denominated holdings for the year ahead. A resilient Rand, a Fed that held rates for a second straight meeting amid internal dissent, a SARB holding at a restrictive 7.00% repo rate after resuming its hiking bias, and a still-elevated gold price all support this domestic tilt, while a re-escalation of Middle East hostilities and a reversal of Rand strength are the key two-way risks to monitor over the coming twelve months.
Over the twelve months to July 2026, USDZAR total returns in the uploaded dataset were dominated by one theme: sustained Rand resilience against the US Dollar boosted the year-on-year (YoY) return of every Rand-denominated domestic asset class relative to the same assets’ long-run averages, while eroding the Rand value of assets priced in US Dollars. South African inflation-linked bonds (+18.7% YoY), listed property (+26.7% YoY) and equities (+17.2% YoY) show the strongest current YoY returns among the nine asset classes in the reviewed data set, while global bonds (FTSE WGBI, -7.9% YoY), global cash (-5.6% YoY) and US Treasury Bills (-5.4% YoY) all show negative YoY returns once translated into Rand terms. [1]
This report combines that return data with post-February-2026 research from the US Federal Reserve, the SARB, the IMF, the World Bank, Reuters- and Bloomberg-sourced consensus surveys, and named investment-bank research to build a preferential one-year asset allocation case. On balance, the data and the current macro backdrop favour an overweight to South African inflation-linked bonds, nominal bonds and listed property, a neutral-to-modestly-overweight stance on South African equities and money market instruments, and an underweight to unhedged global bonds, global cash and US Treasury Bills, with a smaller, selectively sized strategic allocation retained in global equities for diversification.
Global Macro Backdrop
The US Federal Reserve held its target federal funds range at 3.50%–3.75% at the conclusion of its 28–29 July 2026 FOMC meeting, the second consecutive hold under new Chair Kevin Warsh. Notably, three of the twelve voting FOMC members dissented in favour of an immediate hike, a shift from the unanimous June decision, reflecting a more hawkish tilt among some committee members even as the median stance remained on hold; Chair Warsh characterised the decision as “a rigorous review of the economic situation” rather than a pause. [2, 3, 4]
The IMF’s July 2026 World Economic Outlook Update kept its global growth forecast broadly unchanged on a cumulative basis from April, projecting 3.0% global growth in 2026 (down 0.1 percentage point from April) and 3.4% in 2027, versus an average of 3.5% in 2024–25. The Fund attributes the modest slowdown to the war in the Middle East weighing on energy importers, partly offset by accelerated technology-cycle momentum from artificial-intelligence-related capital spending; global headline inflation was revised up to 4.7% for 2026 from an earlier estimate, as the disinflation trend in place since early 2024 has stalled. [5, 7]
Sub-Saharan Africa is projected by the same July 2026 IMF update to grow 4.3% in 2026, largely unchanged from April, with outcomes diverging sharply between net energy exporters (who benefit from elevated prices assumed at USD 89/barrel) and non-resource-intensive oil importers, who face a harder squeeze from higher energy and food costs. South Africa’s own 2026 growth forecast was put at 1.1% by the IMF in the July update, modestly below the SARB’s own 1.2%–1.4% range discussed below, as the Fund continues to flag “uncertainty and risks” from the reignited Middle East conflict. [6, 8]
South African Macro & Policy
The SARB’s Monetary Policy Committee held the repo rate unchanged at 7.00% on 23 July 2026, in a split 4-2 vote, with two members favouring a further 25-basis-point hike. The decision came despite headline CPI accelerating to 5.0% in June 2026 (from 4.8% in May), above the upper end of the SARB’s 3%±1 percentage point target band, as fuel and transport costs rose on the back of the Middle East-driven oil-price shock. Governor Lesetja Kganyago noted the Committee “sees upside risks to inflation” but judged an immediate hike premature; the SARB simultaneously lowered its 2026 inflation forecast to 4.0% (from 4.4%) and raised its 2026 GDP growth forecast to 1.4% (from 1.2%), balancing a fragile growth recovery against still-elevated price pressures. The prime lending rate remains at 10.50%. [9, 10, 11, 12]
South Africa’s real GDP grew 0.5% quarter-on-quarter in Q1 2026, according to Statistics South Africa data cited by Deloitte, up from 0.4% in the previous quarter, evidence that a reform-driven recovery that was gaining momentum before the external energy shock remains broadly intact even as near-term growth has been marked down. The narrow 4-2 MPC vote in July leaves the SARB’s next meeting in genuine play, with markets pricing roughly even odds of a further hike should the Middle East conflict keep oil and food prices elevated; a higher and rising repo rate mechanically increases the carry available on South African nominal bonds, inflation-linked bonds and money market instruments relative to global peers. [13, 14]
Rand (ZAR) Outlook
USD/ZAR traded at approximately 16.20 on 11 August 2026, having strengthened 1.62% over the preceding month and 7.89% over the preceding twelve months — a materially firmer Rand than a year earlier, and the principal driver of the return divergence documented in this report. A survey of 14 currency-forecasting providers compiled by ExchangeRates.org.uk (updated 12 August 2026) shows a consensus lean toward continued Rand firmness against the Dollar, with the aggregated quarterly path pointing to USD/ZAR easing toward roughly 16.1–16.4 into early 2027; the same source’s methodology applies a Tukey-filtered, recency-weighted average across contributing bank and independent forecasts to reduce the influence of outliers. [15, 16, 17]
This consensus direction is a structural headwind for unhedged foreign-currency holdings translated back into Rand: even where the underlying US-Dollar return on a global asset is healthy, continued Rand firmness compresses — or, as the data below shows, currently reverses — the Rand-translated return that a South African-based investor actually receives. Conversely, a reversal of Rand strength — for example on renewed Middle East escalation, a wider current-account deficit, or a more hawkish-than-expected Fed — remains a genuine two-way risk to this positioning and is discussed further under Key Risks below.
Commodities, Gold & the JSE
The World Bank’s April 2026 Commodity Markets Outlook projects its precious-metals price index up 42% for full-year 2026 — the strongest of any commodity category, ahead of energy (+24%) and base metals (+17%) — with gold and platinum reaching record highs in the first quarter of the year on heightened geopolitical tensions and strong safe-haven and central-bank demand. Wall Street forecasts for gold have since diverged materially: JPMorgan cut its Q4 2026 target by roughly 25% to USD 4,500/oz on 3 July 2026 (from an earlier USD 6,000/oz call), citing softer near-term demand and rate sensitivity, while Goldman Sachs (USD 4,900/oz) and Bank of America (USD 4,800/oz) remain more bullish for the same period; all three banks nonetheless retain a structurally bullish multi-year view built on continued central-bank gold buying. [18, 19, 20]
This gold and platinum-group-metals strength directly benefits the resources-heavy JSE. The FTSE/JSE All Share Index traded around 111,500 points in early July 2026, supported through the first half of the year by strong gold- and platinum-mining performance even as a stronger US Dollar and periods of softer gold prices created intermittent headwinds; mining and resources counters such as Harmony Gold, Impala Platinum and Northam have been repeatedly cited as swing factors for the index’s day-to-day direction. Because South African investors experience domestic equities directly in Rand, the JSE’s resources-driven gains are captured in full by the local-equities return series in the uploaded dataset, without the currency-translation drag that applies to offshore holdings. [21, 22]
Bloomberg and Reuters Consensus on Global Equities
Bloomberg-sourced consensus forward earnings estimates for the MSCI All Country World Index (ACWI) imply roughly 24% 12-month-forward earnings growth as of mid-2026, up sharply from the prior four-quarter average of 11%, driven substantially by artificial-intelligence-related capital expenditure; the largest technology firms are reported by Bloomberg to be planning over USD 750 billion in aggregate 2026 capex, rising toward USD 1 trillion in 2027. Charles Schwab’s mid-year 2026 global equity outlook, drawing on this Bloomberg consensus data, cautions that this earnings growth is narrowly concentrated — the Information Technology sector is roughly 31% of MSCI ACWI by weight but is forecast to contribute 55% of total projected 2026 earnings growth — which increases the risk of a sharper pullback if AI-related earnings disappoint. [23, 24, 25]
Because South African investors experience global indices net of Rand movements, the Rand strength documented in the Rand Outlook section above has been eroding the Rand-translated return on global equities relative to their healthy underlying US-Dollar performance — a dynamic directly visible in the uploaded return data discussed below, where the MSCI ACWI’s latest USDZAR YoY return of 11.5% sits below both its own trailing 12-month average (13.4%) and its 17-year historical average (16.4%).
36-Month Trend in YoY Total Returns
The uploaded dataset of rolling 12-month, USDZAR-denominated returns (July 2009 to July 2026) shows a clear divergence over the trailing three years between Rand-denominated domestic assets and Dollar-denominated global assets translated into Rand. Averaging the last 36 monthly YoY observations, South African listed property (+24.6% p.a.), equities (+20.2% p.a.) and nominal bonds (+16.5% p.a.) have outpaced global equities in Rand terms (+17.8% p.a., achieved despite currency translation headwinds) and have far outpaced unhedged global bonds and cash (+0.7% and +2.5% p.a. respectively), which were depressed by the same broad Rand resilience that boosted local real-asset returns.
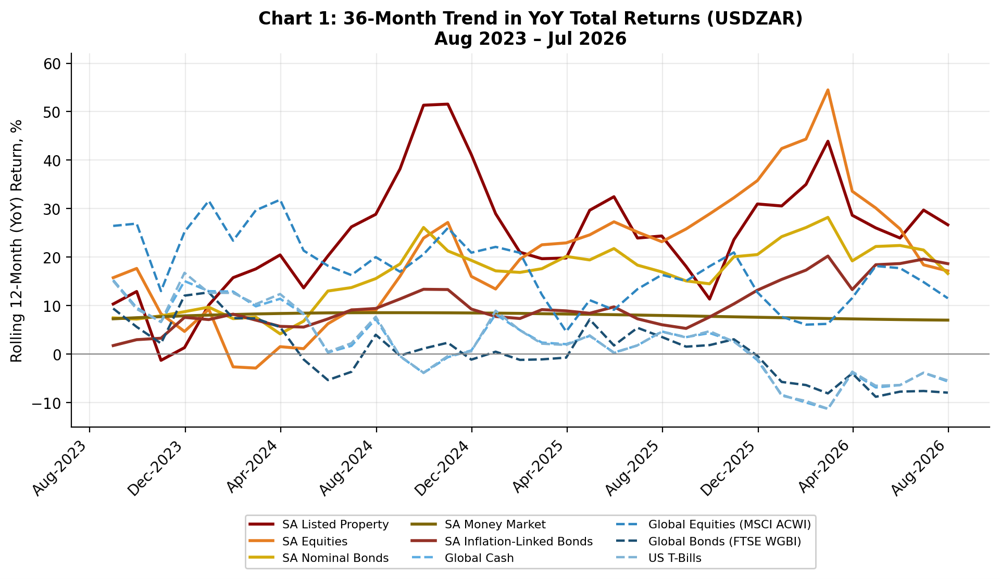
The chart shows the steady divergence between Rand-denominated domestic assets (upper cluster of lines, generally positive and rising into 2026) and Dollar-denominated global assets translated into Rand (lower cluster, falling into negative YoY territory from late 2025 onward). The crossover became most pronounced from late 2025, coinciding with a sustained period of Rand resilience against the Dollar — itself a function of South Africa’s still-restrictive 7.00% repo rate, improving current inflation dynamics relative to a year earlier, and the Reuters/bank-survey-evidenced consensus lean toward continued Rand firmness discussed in the Rand Outlook section above. South African inflation-linked bonds show the sharpest recent acceleration among domestic assets, consistent with the SARB’s resumed hiking bias and elevated near-term inflation prints.
Latest vs 12-Month and 17-Year Average Returns
Chart 2 compares, for each of the nine asset classes, the latest monthly YoY return against its own trailing 12-month average and its full 17-year historical average (July 2009–July 2026), together with a z-score measuring how many standard deviations the latest reading sits from its own long-run history. South African inflation-linked bonds stand out as running well above both their own 12-month and 17-year averages (z-score of 1.97), and South African nominal bonds are similarly elevated (z-score of 1.13), consistent with a market pricing in higher-for-longer domestic real yields as the SARB resumed its hiking bias in May 2026. South African listed property and equities remain solidly positive in absolute terms but are decelerating relative to their own 12-month averages, suggesting the strongest part of the recent domestic re-rating may be behind, rather than ahead of, investors.
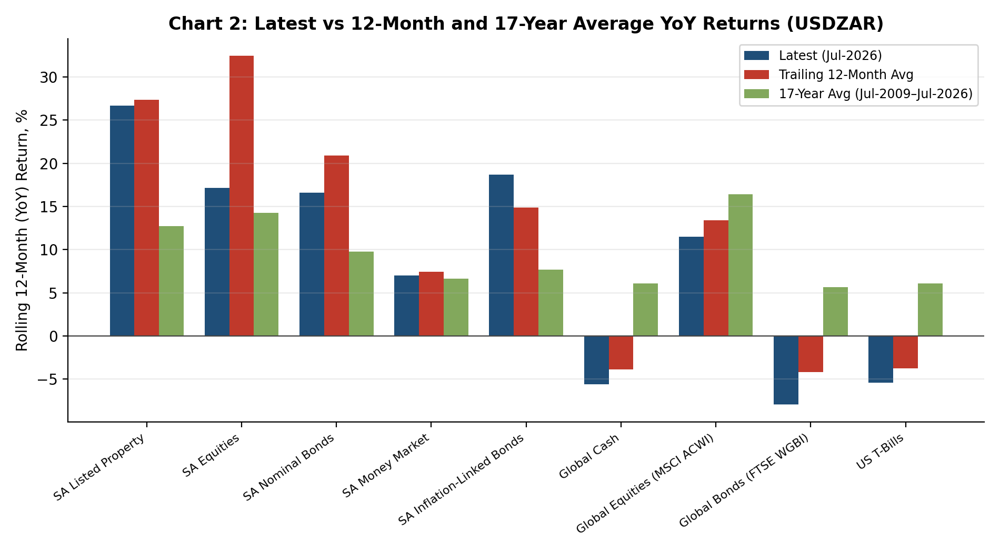
By contrast, all three unhedged foreign asset classes — global bonds, global cash and US Treasury Bills — sit below both their 12-month and 17-year Rand-return averages, each with a negative z-score (-1.05, -0.88 and -0.87 respectively), reflecting the drag of continued Rand resilience rather than any deterioration in the underlying US-Dollar or global return; the World Bank’s April 2026 commodity outlook and current Fed policy stance both discussed above are consistent with this pattern persisting in the near term absent a sharp reversal in the Rand.
Preferred Asset Class Positioning — Next 12 Months
Our preferred asset classes and the supporting rationale, drawing together the return data and the macro research cited throughout this report, are summarised below. “3-Yr Avg Return” is the simple average of the last 36 monthly YoY USDZAR observations.
Asset Class | 3-Yr Avg Return | Stance | Rationale |
SA Inflation-Linked Bonds | +10.2% | Overweight | Explicit hedge against the current oil/food-driven CPI upswing (5.0% June 2026 headline print); z-score of 1.97 shows real yields still repricing higher. |
SA Nominal Bonds (ALBI) | +16.5% | Overweight | High carry at a restrictive 7.00% repo rate; direct beneficiary if the SARB holds or eventually cuts once the energy shock fades. |
SA Listed Property | +24.6% | Overweight | Highest 3-year return of the nine asset classes; geared to eventual lower long-bond yields and resilient domestic demand. |
SA Equities (JSE All Share) | +20.2% | Overweight | Gold- and platinum-mining windfall from the World Bank’s +42% 2026 precious-metals forecast; resources-heavy index captures commodity strength directly in Rand. |
SA Money Market / Cash | +8.0% | Core / Neutral | Near risk-free ~7% nominal yield at the current repo rate; low-volatility ballast against geopolitical shocks. |
Global Equities (MSCI ACWI) | +17.8% | Neutral | Strong in USD terms (Bloomberg consensus +24% forward earnings growth), but Rand-translated gains depend on continued Rand firmness not eroding them further. |
Global Cash (USD) | +2.5% | Underweight | Positive in USD, but consensus currency-survey evidence for continued Rand firmness caps unhedged Rand returns. |
Global Bonds (FTSE WGBI) | +0.7% | Underweight | Low starting real yields, a Fed still holding at a restrictive range with hawkish dissent, and consensus for a firmer Rand are a double headwind. |
US Treasury Bills (S&P Index) | +2.6% | Underweight | Positive in USD but, like global cash, offers the least compelling Rand-translated risk-adjusted case of the nine asset classes reviewed. |
Key Risks to the Case
- A renewed escalation or prolongation of the Middle East conflict could push oil prices and South African inflation higher than the SARB’s current 4.0% 2026 forecast, forcing a steeper hiking path than currently priced and pressuring domestic bond prices even as carry improves.
- A reversal of recent Rand resilience — for example if a hawkish-dissent-driven Fed hike materialises, or if the currency-survey consensus for continued Rand firmness proves wrong — would narrow or reverse the current gap between domestic and foreign asset returns in Rand terms.
- Elevated and narrowly concentrated global equity earnings growth (Bloomberg consensus +24% forward, ~55% of it from a single sector) increases the risk of a sharper drawdown in global equities than the consensus base case assumes, per Charles Schwab’s mid-year 2026 outlook.
- South Africa’s growth outlook remains fragile: the IMF’s July 2026 update puts 2026 GDP growth at just 1.1%, and the SARB’s own 4-2 split MPC vote in July signals genuine committee disagreement about the appropriate policy path.
- Wall Street’s own gold forecasts for Q4 2026 span a wide USD 4,500–4,900/oz range across JPMorgan, Goldman Sachs and Bank of America; a sharper-than-expected pullback in gold would disproportionately affect the resources-heavy JSE and South African listed property, which are running at multi-year-high momentum.
- SA equities and listed property are running at multi-year-high momentum (26.7% and comparable strength respectively on a latest YoY basis); a reversal or profit-taking event would disproportionately affect these higher-volatility asset classes relative to bonds.
- A more hawkish Fed than currently priced — already visible in the three-member dissent at the July 2026 FOMC meeting — would tighten global financial conditions and could reverse recent Rand resilience, undermining the core currency-driven thesis of this report.
Conclusion
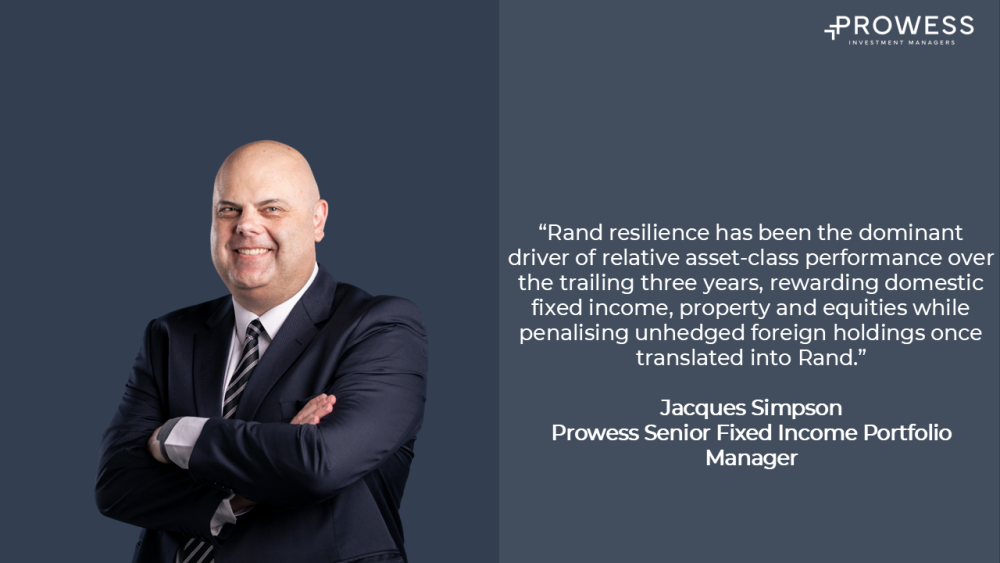
The historical return data in the uploaded dataset, read alongside the most recent Federal Reserve, SARB, IMF, World Bank, and Bloomberg- and Reuters-sourced consensus research, tells a consistent one-year story: Rand resilience has been the dominant driver of relative asset-class performance over the trailing three years, rewarding domestic fixed income, property and equities while penalising unhedged foreign holdings once translated into Rand. With the SARB holding at a restrictive 7.00% repo rate after resuming a hiking bias, and with inflation risk still skewed to the upside from the Middle East energy shock, the preferential allocation for the year ahead tilts toward South African inflation-linked bonds, nominal bonds and listed property, with continued but more measured exposure to domestic equities and money market instruments, and a smaller, partially diversifying allocation retained in global equities. Unhedged global bonds, global cash and US Treasury Bills currently offer the least compelling risk-adjusted case in Rand terms among the nine asset classes reviewed and warrant the lowest weight in the set.
Disclaimer
This document is for general information purposes only and does not constitute investment, financial, tax or legal advice. It is not a recommendation to buy or sell any security. Past performance, including the historical returns in the supplied dataset, is not indicative of future results. Forecasts cited from third parties (the US Federal Reserve, SARB, IMF, World Bank, investment banks, currency-forecast surveys and other named sources) are subject to change and involve inherent uncertainty; all cited sources were published within six months of this report’s 12 August 2026 date. Readers should consult a licensed financial adviser before making investment decisions.
Full List of Sources & References
Bracketed numbers in the text above — e.g. [2, 3, 4] — refer to the numbered sources below. All third-party sources were published within six months of this report’s 12 August 2026 date (i.e. no earlier than 12 February 2026). Historical asset-class return figures, tables and both charts in this report are drawn exclusively from the client-supplied dataset (source 1); all macroeconomic, policy, currency and market-consensus commentary is drawn from sources 2–25.
- Client-supplied workbook ‘Pres_3.xlsx’ (Sheet1) — rolling 12-month (YoY) total returns by asset class, monthly, July 2009–July 2026, in USDZAR. Sole source for all historical asset-class return figures, tables and charts in this report.
- Federal Reserve, FOMC Statement and Implementation Note, 29 July 2026. https://www.federalreserve.gov/monetarypolicy/fomcpresconf20260729.htm
- CNBC, “Fed meeting recap: July 2026,” 29 July 2026. https://www.cnbc.com/2026/07/29/fed-meeting-today-live-updates.html
- Forbes Advisor, “Federal Funds Rate History 1990 to 2026,” updated late July 2026. https://www.forbes.com/advisor/investing/fed-funds-rate-history-1/
- International Monetary Fund, “World Economic Outlook Update, July 2026: Global Economy in Crosscurrents of War and Technology,” 8 July 2026. https://www.imf.org/en/publications/weo/issues/2026/07/08/world-economic-outlook-update-july-2026
- International Monetary Fund, World Economic Outlook Update, July 2026 (full PDF, Annex Table 1). https://www.imf.org/-/media/files/publications/weo/2026/update/july/english/text.pdf
- IMF Press Briefing Transcript, World Economic Outlook Update, 8 July 2026. https://www.imf.org/en/news/articles/2026/07/08/tr070826-weo-press-briefing-transcript-july-8-2026
- Jacaranda FM / Bulletin Newswatch, “IMF expects SA economic growth to remain stable,” 9 July 2026. https://www.jacarandafm.com/news/news/imf-expects-sa-economic-growth-to-remain-stable/
- Moneyweb, “Sarb holds rates steady at 7%,” 23 July 2026. https://www.moneyweb.co.za/news/economy/sarb-holds-rates-steady-at-7/
- EWN, “SARB keeps interest rates unchanged, surprising markets and analysts,” 23 July 2026. https://www.ewn.co.za/2026/07/23/sarb-keeps-interest-rates-unchanged-surprising-markets-and-analysts
- Ground News, summary of the SARB’s July 2026 MPC decision. https://ground.news/article/central-bank-announced-the-fifth-interest-rate-decision-of-the-year-has-been-determined
- Financial Afrik, “South Africa: SARB maintains its repo rate at 7%, a hike remains possible,” 28 July 2026. https://www.financialafrik.com/en/2026/07/28/south-africa-sarb-maintains-its-repo-rate-at-7-a-hike-remains-possible/
- FocusEconomics, “South Africa Interest Rate Outlook & Data,” updated 22 June 2026. https://www.focus-economics.com/country-indicator/south-africa/interest-rate/
- Deloitte Insights, “South Africa economic outlook,” updated 26 June 2026. https://www.deloitte.com/us/en/insights/topics/economy/emea/africa-economic-outlook.html
- Trading Economics, “South African Rand — Quote, Chart, Historical Data, News,” data as of 11 August 2026. https://tradingeconomics.com/south-africa/currency
- ExchangeRates.org.uk, “Rand to Dollar Forecast,” 14-provider consensus survey updated 12 August 2026. https://www.exchangerates.org.uk/currency-forecasts/rand-to-us-dollar-forecast
- ExchangeRates.org.uk, “Dollar to Rand Forecast,” updated 12 August 2026. https://www.exchangerates.org.uk/currency-forecasts/us-dollar-to-rand-forecast
- World Bank Group, Commodity Markets Outlook, April 2026. https://thedocs.worldbank.org/en/doc/f3138644a1e8e2bb631399ae11d6c408-0050012026/commodity-markets-outlook-april-2026
- World Bank Blogs, “The Commodity Markets Outlook in eight charts,” 11 May 2026. https://blogs.worldbank.org/en/developmenttalk/the-commodity-markets-outlook-in-eight-charts3
- GoldSilver.com, “JPMorgan Cut Its Gold Forecast by 25%. Here’s What Long-Term Holders Need to Know,” late July 2026. https://goldsilver.com/industry-news/article/jpmorgan-gold-forecast-2026/
- FX Leaders, “JSE FTSE All Share Index Rises Despite Stronger US Dollar and Weaker Gold Prices,” 6 July 2026. https://www.fxleaders.com/news/2026/07/06/jse-ftse-all-share-index-rises-despite-stronger-us-dollar-and-weaker-gold-prices/
- FX Leaders, “JSE FTSE All Share Index Climbs on Weak Dollar, Mining Shares and New Listings,” 29 June 2026. https://www.fxleaders.com/news/2026/06/29/jse-ftse-all-share-index-climbs-on-weak-dollar-mining-shares-and-new-listings/
- Charles Schwab, “Global Equities Mid-Year Outlook 2026,” June 2026. https://international.schwab.com/story/global-stock-market-outlook
- Charles Schwab, “Navigating the Global Earnings Boom,” July 2026. https://www.schwab.com/learn/story/navigating-global-earnings-boom
- MSCI, “Mapping AI Exposure Across Global Markets,” 10 July 2026. https://www.msci.com/research-and-insights/blog-post/mapping-ai-exposure-across-global-markets