

Asset Class Returns in the South African Context
A comparison of asset class performance typically begins with a review of recent returns, an assessment of relative valuation across markets, and an evaluation of forward-looking opportunity sets. Such analysis requires a robust quantitative foundation. With this in mind, we examined the performance of major South African asset classes over the past 10 years, using daily data and rolling 12-month returns.
1. Recent Performance: Broad-Based Strength Across Asset Classes
The chart below plots annual returns (as of each December) for key asset classes over the past decade. With the exception of STEFI, industrials, financials and the short-end of the ALBI bucket (0–3 years), virtually all asset classes have delivered returns exceeding 20% most recently.
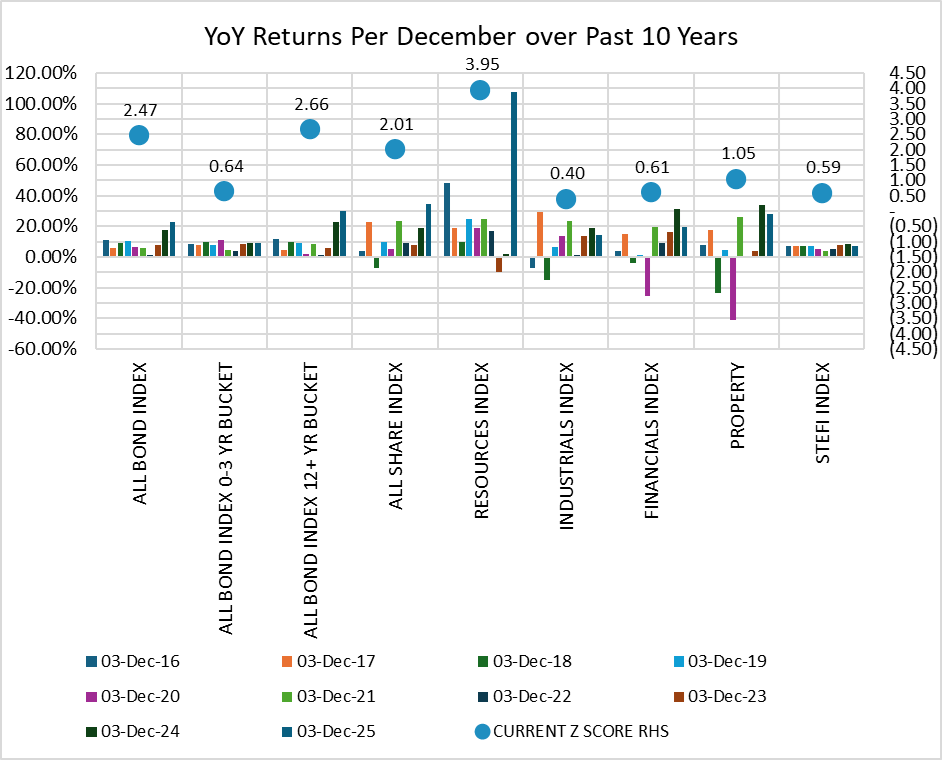
One may have expected a far wider dispersion of outcomes. Instead, the opposite occurred: asset classes moved together and generated simultaneously strong returns. This clustering suggests unusually high positive correlations across asset classes and therefore limited benefits from Markowitz-style diversification portfolio construction.
2. Why Are Returns Converging?
We argue that this convergence reflects shared value drivers that have supported a broad rerating across South African assets. Key recent contributors include:
- A stable and appreciating rand, reducing risk premia and supporting both local and rand-hedge assets.
- Domestic policy rate cuts, lowering discount rates across the yield curve.
- US rate cuts, easing global financial conditions and boosting emerging-market risk appetite.
- Domestic structural inflation falling toward 3%, improving the macro backdrop and allowing SA’s inflation target to be gradually reduced.
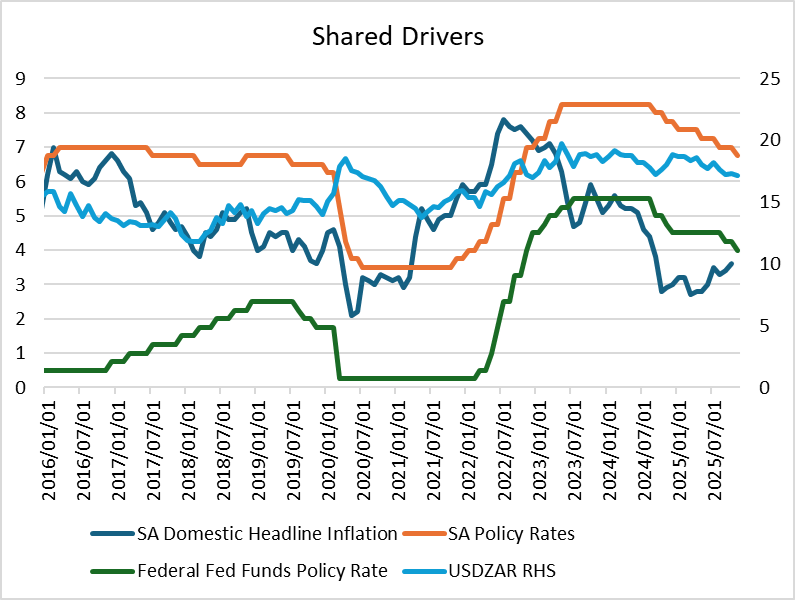
Together, these drivers have created a powerful global and local “risk-on” environment, compressing risk premia across the board and leading to unusually strong, synchronized returns.
3. Z - Score Analysis: Identifying Extremes
This leads us onto the next logical question – which asset classes will outperform most, and where should one be more defensive?
The next step in our analysis uses Z-score bands of YoY returns for each asset class over the past decade. These bands cover x % of return observations, meaning x percent of the time we expect the returns to print between these bands. These metrics are in black. The blue dots represent 10-year average YoY returns, and orange dots reflect current YoY returns.
Whenever an orange dot lies outside the bands, the latest return is considered an extreme reading—i.e., several standard deviations away from its long-term average. The orange data is labelled with their respective Z-scores, in other words, how many multiples of the standard deviation are we trading away from the average return.
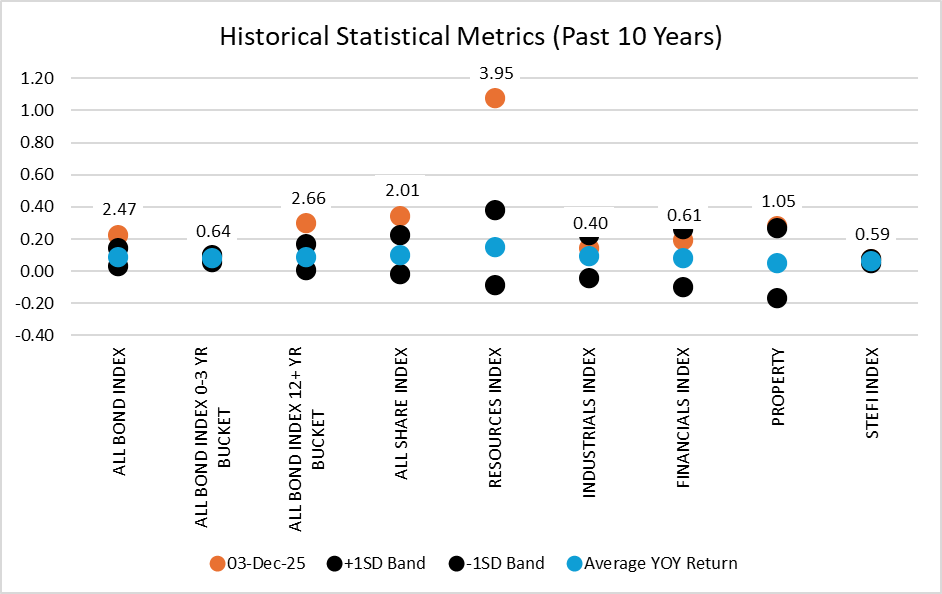
4. Key Findings from Z - Scores
- Local bonds and equities are both highly overvalued, with Z-scores above 2. Such extremes occur only a small percentage of the time, indicating that current returns are well beyond normal historical variation.
- Within equities, valuations and relative Z-scores suggest that industrials, financials, and listed property are the more attractive sectors, in that order.
- Resources have benefitted heavily from high commodity prices and currency stability, putting the latest returns at elevated—and harder to sustain—levels.
5. Outlook by Asset Class
Bonds:
Despite appearing overvalued, SA bonds may stay elevated a while longer. Continued rate cuts and the recent sovereign credit re-rating provide meaningful tailwinds to duration.
Equities:
Selectivity is key. Industrials, financials, and listed property are preferred, while resource counters look stretched following outsized gains driven by commodities.
STEFI/Cash:
We expect STEFI returns to soften as the rate-cutting cycle proceeds, reducing cash yields over the coming months.